This is my first blog to the planet, so be gentle :)
I'm maintaining "System Activity" aka "System Monitor" aka "ksysguard" aka "KDE version of Windows Task Manager". It's the thing that pops up when you press ctrl+esc or press
 in krunner.
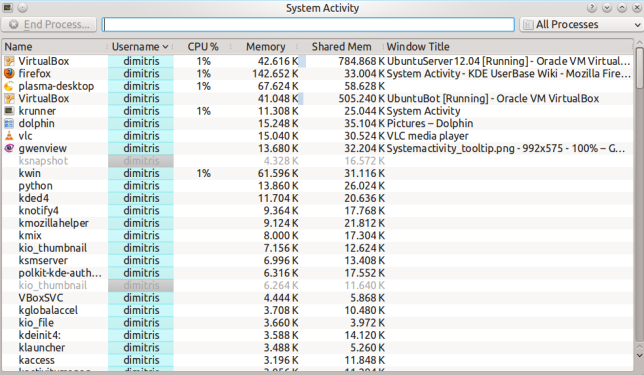
For 4.4, I focused mostly stability - about a dozen bug reports were fixed. But we also have a few cool features. My favourite is actually the simplest - it shows processes that have died as grayed out. Like so:
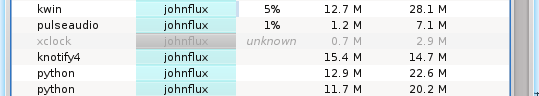
This looks really cool when you're compiling something and you can see the gcc instances coming and going.
We also have some new columns that can be shown, display I/O statistics for example. This is really cool, you can see exactly how much each process has read or written to the hard disk, with many options on how to view the information.
We also have a nice increase in speed for the graphs - that made it in just in time for 4.4. I measured an improvement from 50ms per frame to 10ms per frame for a QWidget and 15ms for a QGraphicsWidget. The process list has also seen some performance increases - nothing quite so major, but every little helps. The plasma signalplotter widget, unfortunately, doesn't benefit from this, but it will in KDE 4.5. I couldn't get this done in time.
Also I did quite a bit of polishing. Note the lack of margins in the dialog box - this requires doing a few tricks with KDialog. First, you have to force KDialog to create its inner layout by calling
minimumSizeHint(), before setting the contents margins to 0. Like so: (void)minimumSizeHint(); //Force the dialog to be laid out now
layout()->setContentsMargins(0,0,0,0);Then to get a nice resize-handle grip, we have to 'trick' the QTreeView into allocating the space for it, so that the scrollbars are properly offset. Like:
    myTreeView->setCornerWidget(new QWidget);
    setSizeGripEnabled(true);
13 comments:
I've actually started using KSysGuard quite often recently. Previously, I used top (aliased to the more fancy htop) to check what's going on in my system, and to kill a process here and there.
I've now changed behaviour to ctrl+esc and it's better, faster and more convenient.
I think you've reached quite a nice milestone if you get people like me to change their habit to use a GUI app instead of a CLI one. :)
Nice dead processes and IO are two reasons I kept coming back to 'atop', but it sounds like I'll be happy with ksysguard from 4.4 onward :)
Two questions about dead processes :
* the cpu column in your screenshot shows 'unknown', can that be fixed ?
* when was the memory consumption measured ?
Very nice job :)
* the cpu column in your screenshot shows 'unknown', can that be fixed ?
Fixed and backported to 4.4. Originally it was like that because I was going to make the string "finished" but we were in string freeze..
Instead I'll just leave it blank.
* when was the memory consumption measured ?
From the last time the process was seen alive. The same applies for CPU usage etc. There's no way to determine what its real final memory/cpu/etc was.
I have liked very much the graphical improvement in that. Like you can see bars on CPU and memoru consuption.
And the graying out is just great as well! Would it be possible to have the ended process being faded more slowly and have fade effect on it? Like it would take 5-7 seconds to fade?
Fri, it would be cool to do other effects, but I really have think about CPU usage, since the whole thing is about showing the CPU usage of other processes.
KSysguard is pretty nice, however I think having that resize thing there is kind of bad. First of all it looks out of place (wrong color, for one) and second - why? No app in KDE has it...
Nice! Did not notice the i/o colums which are not shown by default.
Would it be possible to add a status bar that contain totals like number of processes, total ram and swap usage, total i/o maybe... etc?
Somehow i seem to feel that my system runs too many process (~160 - 170) lately and that causes system slowness
Nice work! Thanks!
Ah, I meant fixing the "unknown" value by giving the actual amount of CPU used. Leaving the field blank looks like "used less than 1%" (like for other processes) which is typically false for a finished compile process.
I believe getting the CPU usage of dead processes requires turning on process accounting to a file, which may be a lot more work, but brings more trustable numbers.
Moltonel,
Hmm, I think the best way to do that sort of process accounting is to write a script for ksysguard to get that info.
hi John,
thanks for cleaning up the margins! it has been nagging me for a long time :)
The IO column is also an extreme handy addition (any possibility to add network traffic as well?). Died processes in gray has already helped me.
Also, any optimization in ksysguard is useful as I have this app open all the time.
I agree with kishore that a status bar with totals would be handy.
Also, I think a lot of users don't know how to launch the full version of ksysguard. Maybe provide a small button in the top row?
btw, your first screenshot is not clickable to see the full version.
Hi,
There's a big bug on the version distributed with Kubuntu 11.10 (Precise Pangolin).
When the "All processes, Tree" view is selected, the value in the "CPU %" column in the "init" process keeps growing and growing.
The value does not get zero-ed before adding the %ages of the processes using the CPU.
Please fix this bug.
Post a Comment